#include <plotspecification.h>
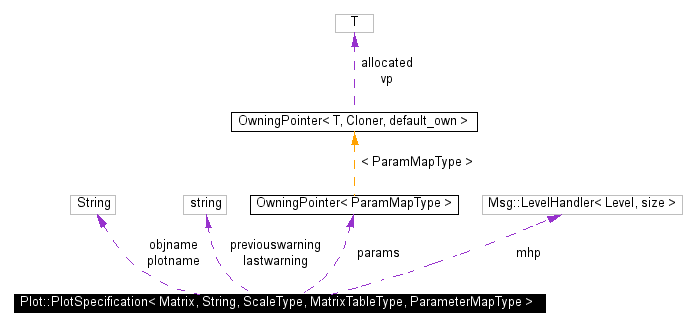
Collaboration diagram for Plot::PlotSpecification< Matrix, String, ScaleType, MatrixTableType, ParameterMapType >:

Allows for parameter-based control of plot types.
At present, two plot devices are supported: PPM image files and gnuplot PostScript files. More can be added here as needed.
Definition at line 118 of file plotspecification.h.
Public Types | |
| typedef MatrixTableType | MatrixTable |
|
typedef Boundary::AAArbitraryRectangle< double, int > | SubRegion |
| Specification for a rectangular subregion of the NeuralRegion. | |
Public Methods | |
| const Matrix * | reference_mapptr () const |
| Returns a map of the size used in the map table, as a reference for creating maps to match. | |
| template<class DerivedFromParamMap> | PlotSpecification (cStr &objectname, const MatrixTable &maptable, cStr &name, DerivedFromParamMap &parentparams, const string &strength_name="", const string &color_name="", const string &confidence_name="") |
| Convenience constructor: puts together a nested parameter map for typical case. | |
| const string | name () const |
| Returns the declared name for this particular plot. | |
| const string | objectname () const |
| Returns the name for the entity which is being plotted, as opposed to the name of the particular plot (i.e. name()). | |
| bool | save_matrix (const string filebase, const MatrixTable *tempmaps=0, const SubRegion *overriding_region=0) const |
| Save the matrix as an ASCII .mat file. | |
| bool | gnuplot_image (const string filebase, const MatrixTable *tempmaps=0, const SubRegion *overriding_region=0) const |
| Create a 3D plot using gnuplot. | |
| Plot::MatrixImage * | bitmap_image (const double master_scale=-1, const SubRegion *reference=0, const MatrixTable *tempmaps=0, const SubRegion *overriding_region=0, const int border_width=-1, const string overriding_colorspec="") const |
| Allocates and returns a bitmap image of the given region using the given set of params. | |
| Plot::AARImage * | bitmap_histogram (const double master_scale, const ParamMap &defaults, const SubRegion *reference, const MatrixTable *tempmaps=0, const string &name="Histogram") const |
| Allocates and returns a bitmap histogram of the given region using the given set of params. | |
| template<class T> T | lookup_param (const string &name, const T &default_val) const |
| If a parameter map is available, looks up the given parameter in it, substituting the default value if no parameter found. | |
| template<class T> T | lookup_param (const ParamMap ¶ms1, const string &name, const T &default_val, const ParamMap *params2=0, const ParamMap *params3=0) const |
| ParamMapType & | param_map () |
| const ParamMapType & | param_map () const |
Static Public Methods | |
| void | message (Msg::MessageLevel m, const string &s, const bool terminate=True) |
|
||||||||||||||||||||||||||||||||
|
Allocates and returns a bitmap image of the given region using the given set of params. For now, assumes parameter names start with ppm_. If there is a matrix with the special name "__StrengthReference" the elements of the strength matrix is computed as values relative to that reference. Definition at line 403 of file plotspecification.h. References ParamMap::get_child(), lookup_color(), Plot::PlotSpecification< Matrix, String, ScaleType, MatrixTableType, ParameterMapType >::lookup_param(), lookup_subregion(), Plot::PlotSpecification< Matrix, String, ScaleType, MatrixTableType, ParameterMapType >::SubRegion, and Tristate. |
|
||||||||||||||||||||
|
Create a 3D plot using gnuplot. Currently only one dimension is used, either the strength (if present) or the color (but as a height, not a color). The other dimensions could be plotted in 3D if gnuplot supported combined plots (e.g. coloring in each grid element in a surface plot), but instead something like Matlab would be needed for that. They could also be combined side-by-side in gnuplot. Definition at line 285 of file plotspecification.h. References ParamMap::get_child(), mat::gnuplot(), lookup_subregion(), Plot::PlotSpecification< Matrix, String, ScaleType, MatrixTableType, ParameterMapType >::name(), Plot::PlotSpecification< Matrix, String, ScaleType, MatrixTableType, ParameterMapType >::objectname(), and Plot::PlotSpecification< Matrix, String, ScaleType, MatrixTableType, ParameterMapType >::SubRegion. |
|
|||||||||
|
Returns a map of the size used in the map table, as a reference for creating maps to match. Assumes that one will only want to do that for regions already having some other plot; if this assumption is false, the map table class can be changed to be constructed with a fixed size, to ensure that all maps within are that size, and to return a dummy map of that size when requested. Definition at line 147 of file plotspecification.h. |
|
||||||||||||||||||||
|
Save the matrix as an ASCII .mat file. Currently only one dimension is used, either the strength (if present) or the color. Definition at line 318 of file plotspecification.h. References ParamMap::get_child(), lookup_subregion(), Plot::PlotSpecification< Matrix, String, ScaleType, MatrixTableType, ParameterMapType >::name(), Plot::PlotSpecification< Matrix, String, ScaleType, MatrixTableType, ParameterMapType >::objectname(), mat::stream_output(), mat::submatrix(), and Plot::PlotSpecification< Matrix, String, ScaleType, MatrixTableType, ParameterMapType >::SubRegion. |
 1.3-rc2