#include <image.h>
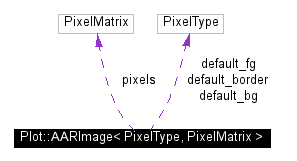
Inheritance diagram for Plot::AARImage< PixelType, PixelMatrix >:


In this class and its derived classes, the emphasis is on generality and simplicity of implementation rather than speed. To be suitable for real-time display, some of the routines may need to be rewritten for common special cases such as axis-aligned straight lines, square box outlines, etc.
All integer coordinate pairs in the base class are in the form (row,column), laid out in standard mathematical matrix order with the origin in the upper left, columns increasing to the right, and rows increasing downwards. All floating-point coordinate pairs are in standard mathematical Cartesian space, with the origin at the lower left, x increasing to the right, and y increasing upwards. In Cartesian space, units are centered in between integer locations, so e.g. the lower left unit is centered on location (0.5,0.5).
Definition at line 41 of file image.h.
Public Types | |
| typedef PixelMatrix::size_type | PixelSubscript |
| Underlying pixel matrix subscript type; could be unsigned. | |
| typedef PixelSubscript | size_type |
| typedef PixelType | value_type |
| typedef double | CartesianCoordinate |
| Arbitrary floating-point x or y position in the plane occupied by the image. | |
Public Methods | |
| AARImage (PixelSubscript height=0, PixelSubscript width=0, PixelType bg=default_bg) | |
| Blank or empty image constructor. | |
| void | draw_pixel (const PixelSubscript r, const PixelSubscript c, PixelType p) |
| Sets the specified pixel to the given color, if in bounds. | |
| const PixelType & | get_pixel (const PixelSubscript r, const PixelSubscript c) const |
| Returns the current value of the specified pixel. | |
| PixelSubscript | nrows () const |
| Returns the number of pixel rows in the image. | |
| PixelSubscript | ncols () const |
| Returns the number of pixel columns in the image. | |
| void | draw_rectangle (PixelSubscript r1, PixelSubscript c1, PixelSubscript r2, PixelSubscript c2, PixelType p) |
| Draws a single-color rectangle bounded by the two specified points. | |
| void | draw_line (PixelSubscript r1, PixelSubscript c1, PixelSubscript r2, PixelSubscript c2, PixelType p, int thickness=1) |
| Draws a single-color line between the two specified points. | |
| void | draw_bar (CartesianCoordinate cx, CartesianCoordinate cy, double angle, double length, double width=1, PixelType p=default_fg, bool always_draw=true) |
| Same as draw_line but specified by the midpoint of the line in Cartesian space rather than endpoints in matrix coordinates. | |
| void | draw_border (size_type borderwidth=1, PixelType p=default_border) |
| Draws a single-color rectangular border around the image. | |
| template<class OutputType> std::ostream & | ppm_write (std::ostream &os, const string &comments="", OutputType max_val=(unsigned char)(255)) const |
| Writes this image to a ppm file. | |
Static Public Attributes | |
| PixelType | default_fg |
| Global defaults. | |
| PixelType | default_bg |
| PixelType | default_border |
Protected Methods | |
| PixelSubscript | col_from_x (const CartesianCoordinate x) const |
| Returns the pixel column corresponding to the specified Cartesian coordinate. | |
| PixelSubscript | row_from_y (const CartesianCoordinate y) const |
| Returns the pixel row corresponding to the specified Cartesian coordinate. | |
| bool | inbounds (const PixelSubscript r, const PixelSubscript c) const |
| Returns true if the given coordinates are within the image matrix. | |
Friends | |
| template<class PType, class PMatrix> std::ostream & | operator<< (std::ostream &s, const AARImage< PType, PMatrix > &o) |
| Writes a readable representation to a stream. | |
|
||||||||||||||||||||||||||||||||||||
|
Same as draw_line but specified by the midpoint of the line in Cartesian space rather than endpoints in matrix coordinates. Takes a center point in Cartesian space, an angle (in radians), and a length. Unlike draw_line, thick lines should approximate a rotated rectangle properly, at least for large enough thicknesses, but they are not implemented very efficiently. The origin is at the at the lower left, with x and y axes increasing to the right and upwards, respectively. The length is specified between the centers of the two endpoint pixels. As a result, a horizontal or vertical bar of length 0 will consist of one pixel, length 1, 2 pixels, length 5, 6 pixels, etc. If a transparent color was passed in, compute an appropriate default from the colors at the line endpoints. Definition at line 298 of file image.h. References Plot::AARImage< PixelType, PixelMatrix >::col_from_x(), Plot::contrasting_color(), Plot::AARImage< PixelType, PixelMatrix >::draw_line(), Plot::AARImage< PixelType, PixelMatrix >::get_pixel(), and Plot::AARImage< PixelType, PixelMatrix >::row_from_y(). Referenced by Plot::MatrixImage< PixelType, PixelMatrix >::draw_bar_on_matrix_element(). |
|
||||||||||||||||||||||||||||||||
|
Draws a single-color line between the two specified points. The "thickness" argument is just a hack. For oblique angles, it draws sheared rectangles instead of rotated ones, but that's better than nothing and much simpler than doing scan line conversion. Definition at line 186 of file image.h. Referenced by Plot::AARImage< PixelType, PixelMatrix >::draw_bar(). |
|
||||||||||||||||||||||||||||
|
Draws a single-color rectangle bounded by the two specified points. The first point is included, and the second is not. Definition at line 170 of file image.h. References Plot::AARImage< PixelType, PixelMatrix >::draw_pixel(). Referenced by Plot::AARImage< PixelType, PixelMatrix >::draw_border(). |
|
||||||||||||||||||||||||
|
Writes this image to a ppm file. You must ensure that the max_val is of the type you want the output to use. Definition at line 143 of file image.h. Referenced by ppm_write_to_file(). |
 1.3-rc2