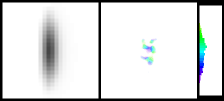
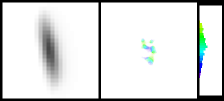
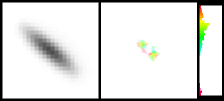
| Demo 7.9. Direct and indirect tilt aftereffect.
This animation of Figure 7.9 shows
how the direct and indirect tilt aftereffects (described in Figure 7.1) emerge in the LISSOM
model. The colors in the response plots (b,d) represent the
orientation preference of each activated neuron according to the color
key on top, and the saturation (i.e. brightness) represents its
activation level. The initial V1 response (b) is based on the
afferent weights only, before the lateral interactions, and is static
in this demo. The settled V1 response (d) shows an animation of how
the final stable activation pattern in response to the input shown in
(a) looks after increasing amounts of adaptation to the vertical line.
The animation repeats automatically once the full level of adaptation
has been reached.
The top row (labeled "Adaptation") shows these responses to the same
input as used for adaptation. After adaptation (iteration 7), the
settled response is weaker, broader, and includes a wider range of
orientations, but the perceived orientation stays approximately the
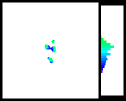
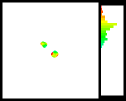
same as before adaptation (iteration 0). For an input with a slightly
different orientation (row "Direct effect"), more units encode
orientations greater than 10o (green areas), and fewer
encode those less than 10o (blue areas) in the settled
response after adaptation than before. The net effect is a direct TAE,
with the perceived orientation shifting away from the adaptation
orientation, from 8.8o to 21.1o. For an input
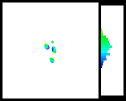
with an orientation very different from the adaptation pattern, the
changes are more subtle (row "Indirect effect"). Only the neurons
around 0o were activated during adaptation. Their
inhibition from other vertical-preferring neurons increased, but
decreased from those not active during adaptation. As a result, the
green-colored neurons nearest 0o are now less inhibited by
the rest of the neurons responding than before adaptation, and so they
respond more strongly. The net effect is an indirect TAE, with the
perceived orientation shifting toward the adaptation orientation, from
57.4o to 54.2o. Therefore, the LISSOM model
explains computationally how the observed tilt aftereffects can arise
from adapting lateral connections.
Previous demo;
Next demo
|