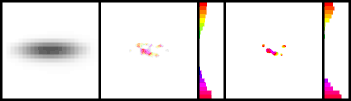
| Demo 7.4. Perceived orientation of the OR map response.
This animation of Figure 7.4 shows
the LISSOM OR map response and its perceived orientation for inputs
with different angles. The colors in the response plots (b,d)
represent the orientation preference of each activated neuron
according to the color key on top, and the saturation
(i.e. brightness) represents its activation level. The initial V1
response (b) is based on the afferent weights only, before the lateral
interactions, and the settled V1 response (d) is the final stable
activation pattern. The perceived orientation is computed from the
orientation and activation values of the response using the vector sum
method (Figure 7.3).
The location of the response in the activity plots (b, d) corresponds
to the location of the pattern on the retina. The initial response
histogram (IH; c) shows that a broad range of orientations are
activated, and that this distribution is approximately centered around
the input's orientation. After settling, the activity is more focused
both spatially and in orientation, as seen in the map activity plot
(d) and its histogram (SH; e). The perceived orientation is an
accurate estimate of the actual orientation of the input pattern at
all angles.
Previous demo;
Next demo
|