With the above analysis, we now simulate the experiments of Gray et al.
[24] with a two-dimensional layer of 10x24 oscillators. The oscillator
layer is constructed such that each oscillator laterally connects to its 8
nearest neighbors, 16 second nearest neighbors, and 24 third nearest
neighbors. Each oscillator is assumed to represent a single distinct
receptive field. The permanent coupling strengths are isotropic and fall
off with distance. This kind of lateral connections is consistent with
the horizontal connections in the primary visual cortex
[19,20]. Proper dynamic connections are formed according to
(4). Following the experimental configurations, Figure 5 presents the
model response to two light bars each corresponding to 2x7 oscillators
separated by 0, 2, and 4 oscillator positions. Oscillators under the bars
were uniformly stimulated while other oscillators received no input.
Cross-correlations were computed for two oscillators within a bar and
between the bars and then normalized for each
trial .
Our simulation
results are presented in the similar format as used by König and Schillen
[34], which illustrates the results in a way readily comparable with the
corresponding experimental results. The upper panels of Figure 5 show
stimulus configurations, and the lower panels present the correlograms.
The cross-correlations within a bar (dashed lines) are compared to those
between bars (solid lines). When two bars formed a single long bar
(Figure 5a), the between-bar correlation was as good as the within-bar
correlation, showing that phase-locking was reached across the entire
long bar. When two bars were separated by 2 oscillator positions, the
between-bar correlation is a little weaker than the within-bar correlation,
but is still significant. The correlations in Figure 5b, however, are weaker
than in Figure 5a, because the configuration in Figure 5b took longer to
reach phase-locking due to weaker links between the two bars. All these
results well match the experimental data
[24]. In Figure 5c,
however, the between-bar correlation is minimal while the within-bar
correlation is almost perfect, showing that phase-locking was readily
reached within each bar but there was no phase relationship between the
two bars. Note that, in this case, there was no direct link between the
two bars. The simulation results demonstrate that the visual cortex with
its own lateral (horizontal) connections is capable of producing
phase-locking of stimulus-driven oscillations, without resort to a global
phase coordinator
[30], all-to-all connections
[55,63], or fixed
time relations among oscillators
[34].
.
Our simulation
results are presented in the similar format as used by König and Schillen
[34], which illustrates the results in a way readily comparable with the
corresponding experimental results. The upper panels of Figure 5 show
stimulus configurations, and the lower panels present the correlograms.
The cross-correlations within a bar (dashed lines) are compared to those
between bars (solid lines). When two bars formed a single long bar
(Figure 5a), the between-bar correlation was as good as the within-bar
correlation, showing that phase-locking was reached across the entire
long bar. When two bars were separated by 2 oscillator positions, the
between-bar correlation is a little weaker than the within-bar correlation,
but is still significant. The correlations in Figure 5b, however, are weaker
than in Figure 5a, because the configuration in Figure 5b took longer to
reach phase-locking due to weaker links between the two bars. All these
results well match the experimental data
[24]. In Figure 5c,
however, the between-bar correlation is minimal while the within-bar
correlation is almost perfect, showing that phase-locking was readily
reached within each bar but there was no phase relationship between the
two bars. Note that, in this case, there was no direct link between the
two bars. The simulation results demonstrate that the visual cortex with
its own lateral (horizontal) connections is capable of producing
phase-locking of stimulus-driven oscillations, without resort to a global
phase coordinator
[30], all-to-all connections
[55,63], or fixed
time relations among oscillators
[34].
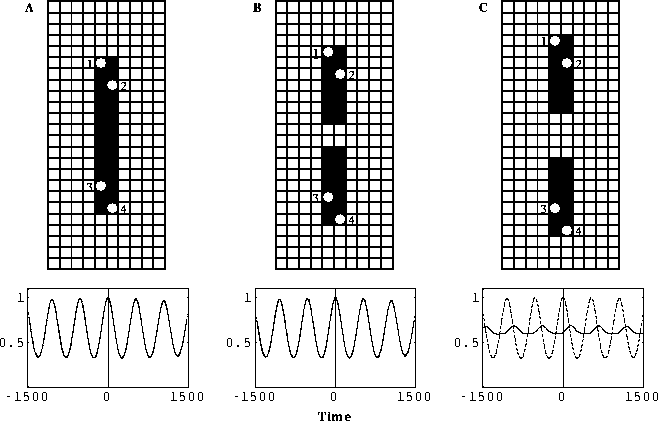
Figure 5: Cross-correlation within and between two
bars in a two-dimensional layer of locally coupled oscillators. The
ratio of the coupling strengths of nearest, second nearest, and third
nearest neighbors is 2:1.6:1 respectively. The overall incoming connection
strength for each oscillator was normalized to 1.25. ( a) The two
bars form a single long bar. ( b) The two bars are separated by
two oscillator positions. ( c) The two bars are separated by 4
positions. The dashed lines are the normalized cross-correlation within
(1-2, 3-4) and the solid lines between (1-3) the two bars. The average
of 10 simulations in shown as in the experiments of Gray et al.
[24].
The oscillators under the bars received external input  , and
the remaining ones received no external input. The initial values
, and
the remaining ones received no external input. The initial values
 and
and  were randomly generated within the range
[ 0.5,0].
The rest of the parameters are the same as in Figure 4. Cross-correlation
was computed for a time interval of 10,000 integration steps after
omitting the initial 3,000 steps.
were randomly generated within the range
[ 0.5,0].
The rest of the parameters are the same as in Figure 4. Cross-correlation
was computed for a time interval of 10,000 integration steps after
omitting the initial 3,000 steps.
In terms of the oscillator activities, the similar pattern of Figure 4 occurred in the two-dimensional case, i.e., a period of rapid transitions appeared in the beginning and it then gave way to stable oscillations with phase locking. The conduction delays between oscillators have been neglected in the above modeling (there is always one discretization step delay in numerical integration), because the delays resulting from neighboring projections are generally much smaller than the cycle periods of the oscillators. Introducing some delays in the horizontal connections does not necessarily yield phase shifts, as one might expect, since neighboring oscillators are mutually connected and they receive external input simultaneously. Our preliminary observations show that up to 0.5 ms delay (assuming 40 Hz oscillations) between neighboring oscillators does not prevent the chain from reaching synchronous oscillations.