Loosely adapted from the Matrix class by Laurent.Deniau@cern.ch. The filename is currently a misnomer; the routines are no longer restricted to TNT matrices.
These routines should work with just about any vector class implementing operator[], e.g. std::vector. Most matrix classes (including MTL and TNT) should also work, as long as they implement operator[][] and have nrows() and ncols() functions. (For TNT one would need a "#define num_cols ncols" and "#define num_rows nrows" before including the headers.)
Usage: [vec::|mat::]gnuplot(<vector-or-matrix>, [<outputfilename>, [<gnuplot-code>, [<axis-coords>]]]);
When no outputfilename is specified, a temporary file is generated and then viewed onscreen. The gnuplot-code can be arbitrary Gnuplot commands, separated by newlines; an occurences of the word "Matrix" in the commands are replaced by the name of the temporary file to which the given vector or matrix is saved. The routines return an error/warning message as a string, or the empty string if no error.
Examples using the TNT matrix and vector classes:
    Vector<double> A(4,    "3  4  8  1");
    Matrix<double> B(4, 4, "3  4  8  1 "
                           "7  8  5  1 "
                           "1  2  6  4 "
                           "2  4  9  7 ");

    // Plot with default axis coords
    vec::gnuplot(A);
    mat::gnuplot(B);

    // Plot with X-axis coords specified by 5x+10
    vec::gnuplot(A,"","",10,5);
    mat::gnuplot(B,"","",10,5,4,2);  // (and Y-axis coords by 2y+4)

    // Plot with specified arbitrary axis coords
    vec::gnuplot(A,"","",Vector<double>(4,"10 15 20 25"));
    mat::gnuplot(B,"","",Vector<double>(4,"10 15 20 25"), Vector<double>(4,"4  6  8 10"));
Note: if you are used to pixel-based image plots, these plots may be somewhat misleading because the integer bounds of the array are used as the floating-point bounds for the plot, with gnuplot linearly interpolating lines between the bounds. This means that each row (and column, for 3D plots) will appear to have one fewer value than they really do. The alternative would be to pad each dimension with an extra data point somehow, but this would look strange if the wrong value were chosen, and would probably be even more confusing in any case.
Definition in file tnt_gnuplot.h.
#include <iostream>
#include <fstream>
#include <cstdio>
#include <string>
#include <vector>
#include "matrix.h"
#include "ind_types.h"
Include dependency graph for tnt_gnuplot.h:

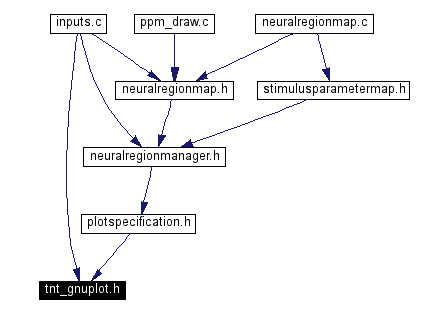
This graph shows which files directly or indirectly include this file:

Go to the source code of this file.
Namespaces | |
| namespace | mat |
| namespace | vec |
 1.3-rc2