|
|


|
Depending on your connection speed, the animation may take a while to
load; it is ready when images appear in the boxes above. The [<]
and [>] buttons wrap around; [<] can be used to get to the final
frame quickly. Original JavaScript animation source from webreference.com.
|
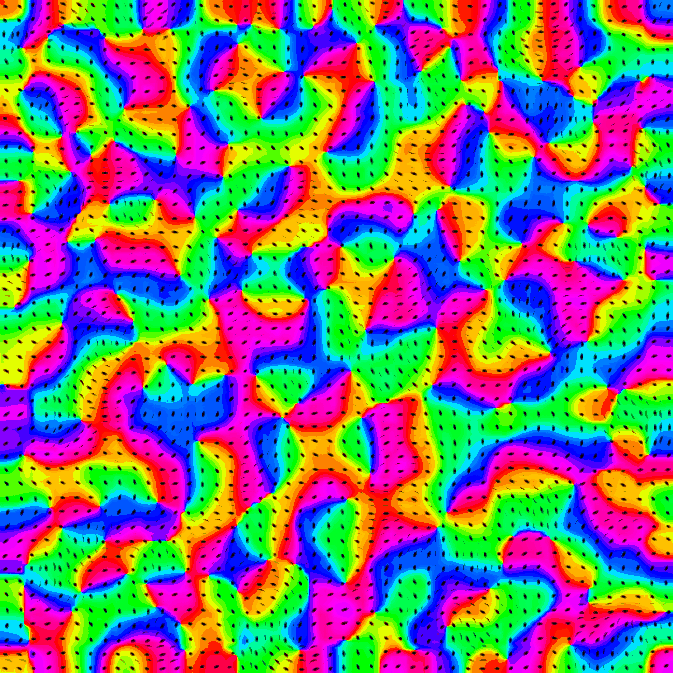
| | Demo 5.23. Structure of the OR/DR map.
This animated version of a network similar to that in
Figure 5.23 shows how the
orientation and direction preferences are organized across the LISSOM
OR/DR map. Each of the 142 × 142 neurons is colored with its
preferred orientation, according to the key on top. For every third
neuron, the moving black bars show one RF at any given time, cycling
through each of the four different lags. The result is a
representation of the preferred stimulus of each neuron, i.e., the
moving pattern that would most excite the neuron.
The direction preferences are generally perpendicular to the preferred
orientation, and large iso-orientation patches are often divided into
two areas with opposite direction preferences. Such an organization
matches experimental data well (Figure
5.4).
Previous demo;
Next demo
| |
|